

Willis eCOA · Data monitoring
Data monitoring and analytics
Willis eCOA was built from the ground up to allow sponsors to keep an eye on their studies better than ever before. Our flag library analyzes data points across the entire platform, going well beyond the clinical data submitted by sites. All data visualizations were designed by our clinical scientists to help quickly pinpoint where attention is needed.
01
Comprehensive event flagging
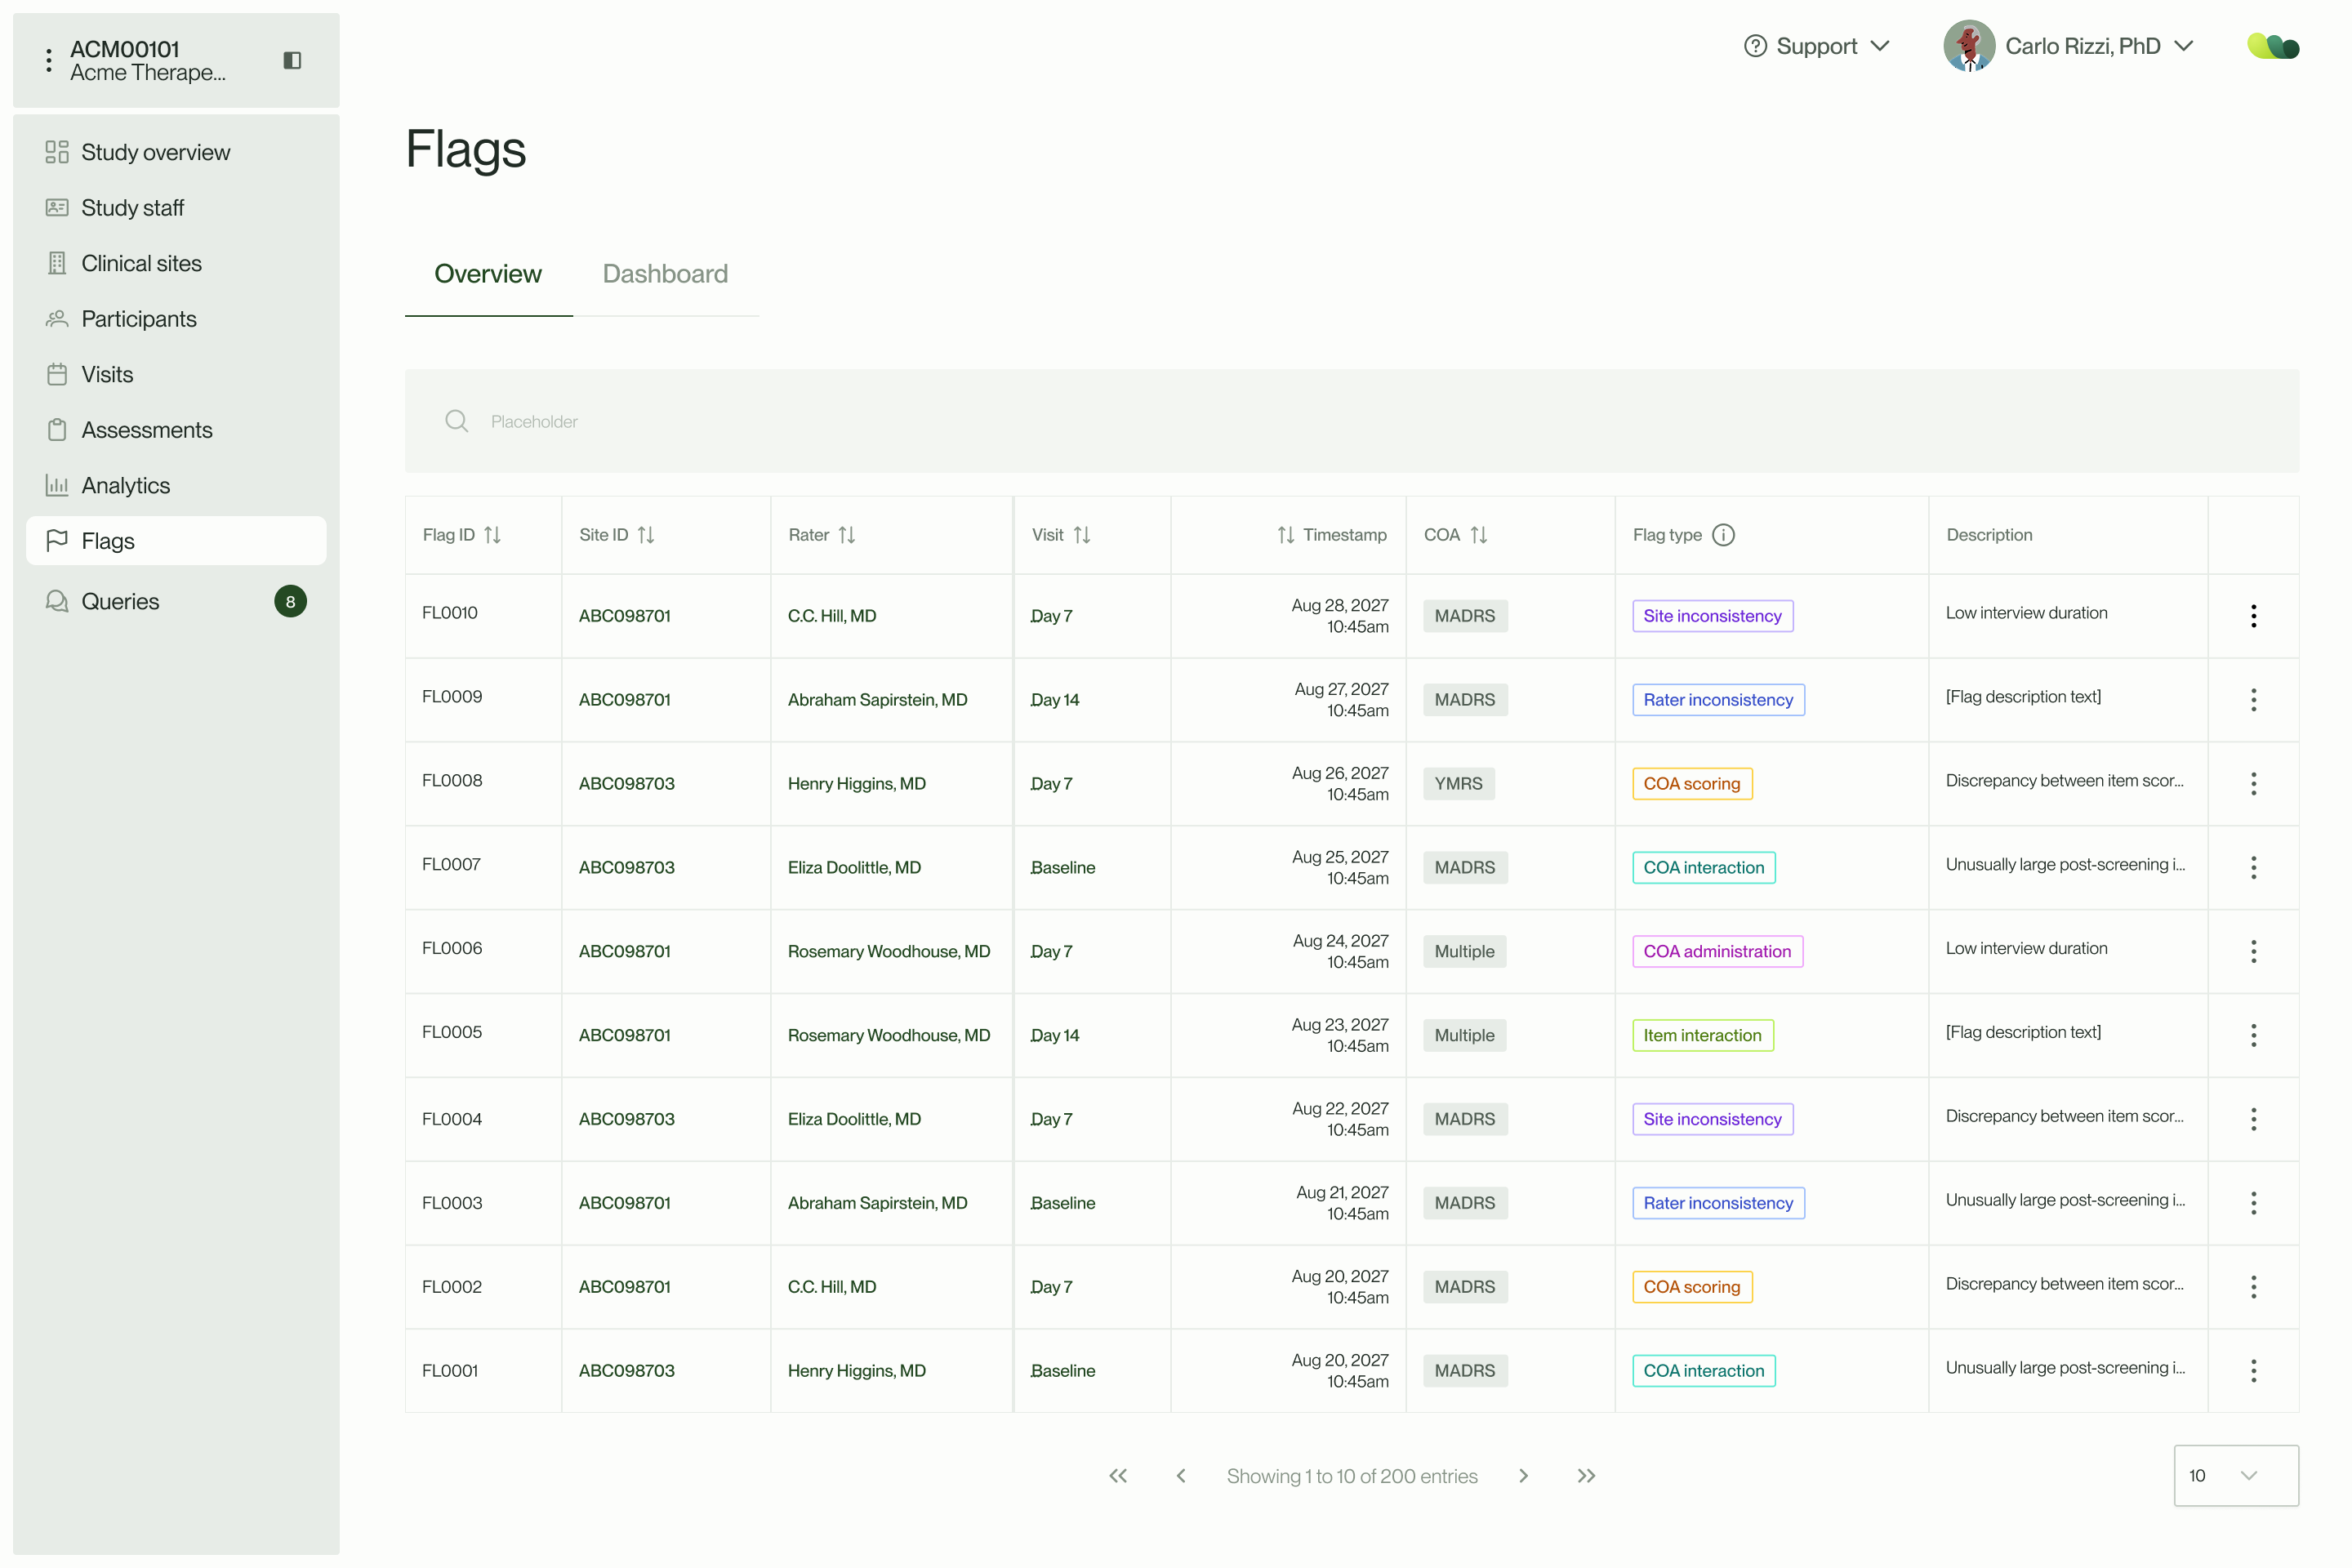
The Willis eCOA flag library, rooted in established clinical literature, has been significantly expanded to utilize the full scope of data collected across the platform. Our flags capture a wide array of data points, including rater training anomalies, metadata irregularities, and longitudinal trends across reviews and queries. The result is a comprehensive library that identifies meaningful signals and clearly indicates where attention is required.
02
Thoughtful data visualizations
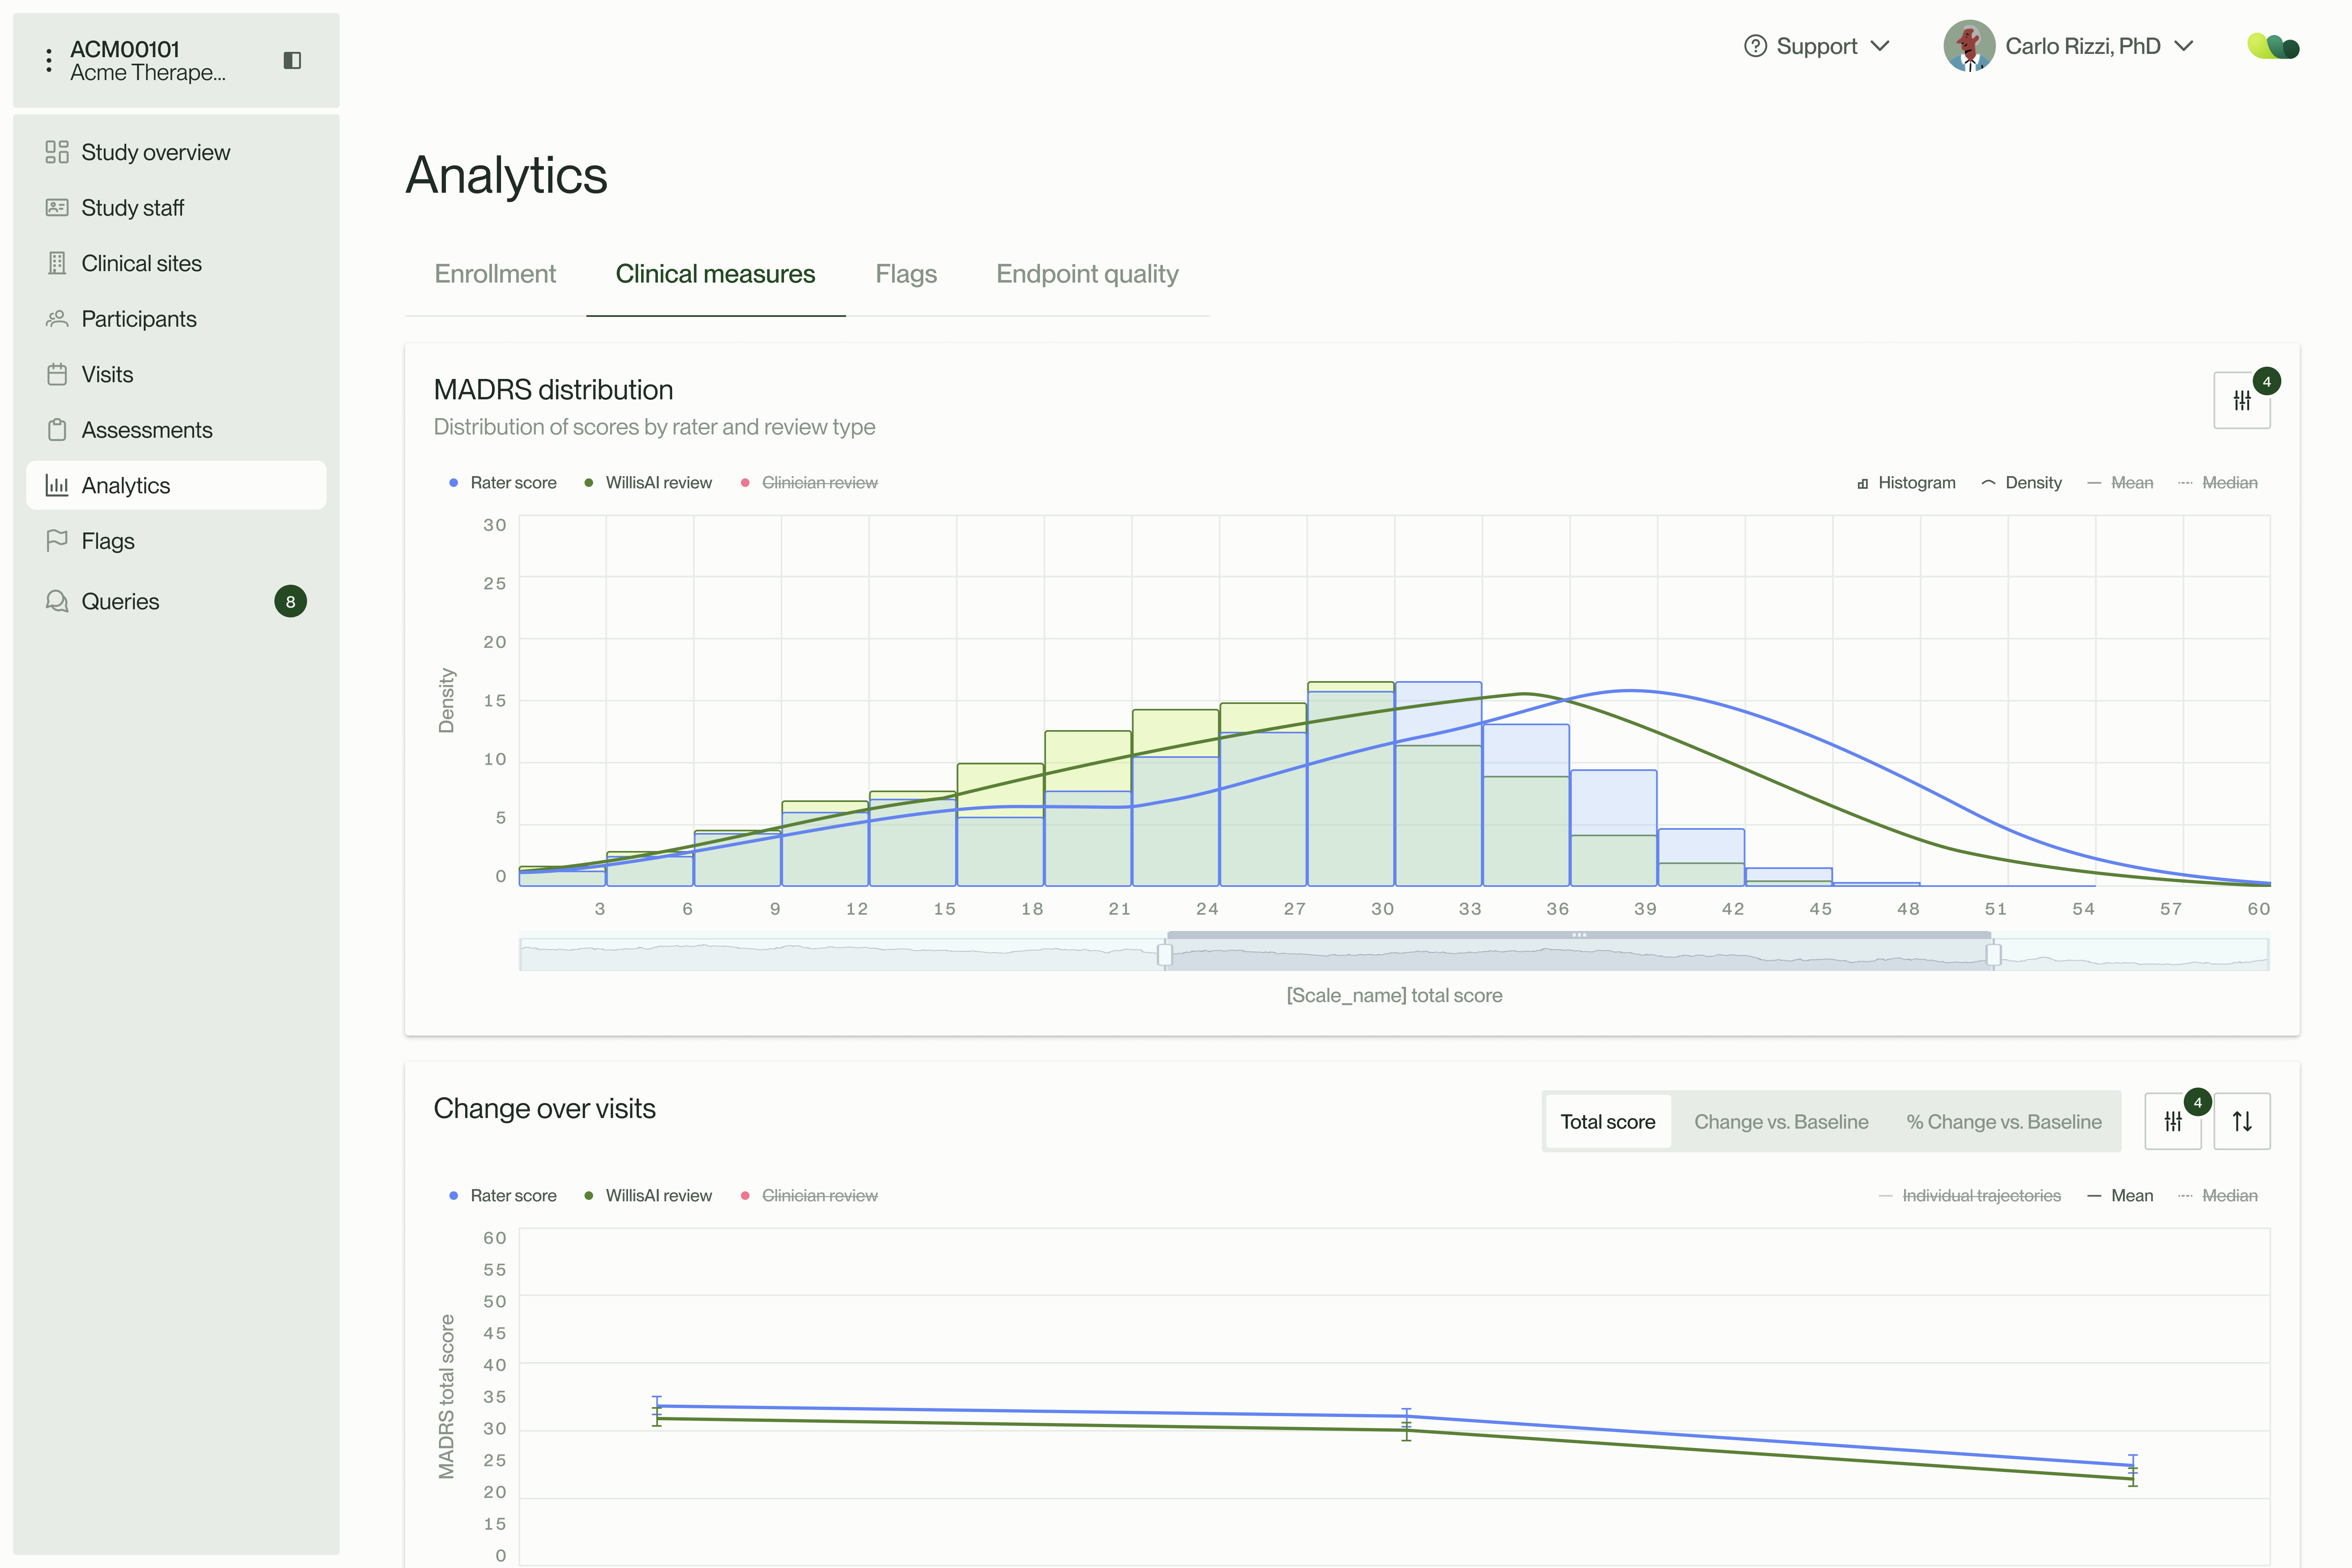
We bypassed third-party analytics tools to build bespoke data visualizations focused squarely on CNS clinical trials. Because these analytics are integrated directly into the platform, all stakeholders have the visibility needed to course-correct proactively. As we gather learnings from active programs, we continuously add new plots and figures to the dashboard.
03
Voiceprint confirmation
Taking full advantage of the data we capture, Willis eCOA uses clinical interview recordings to monitor study participant voiceprints across the study. The system flags instances when a participant's voice does not match across visits, or if the exact same voiceprint appears under two unique participant IDs. These alerts appear directly in the flags dashboard, allowing for quick intervention and resolution.
How Willis eCOA data monitoring stacks up
.png)