


Willis eCOA
A unified platform for endpoint quality in CNS clinical trials

Our mission
We’re out to solve the measurement problem in health.
About Brooklyn Health →100%
Placeholder label
Placeholder: a one-line supporting detail for this stat.
Stat 2
Placeholder label
Placeholder: a one-line supporting detail for this stat.
Stat 3
Placeholder label
Placeholder: a one-line supporting detail for this stat.
01
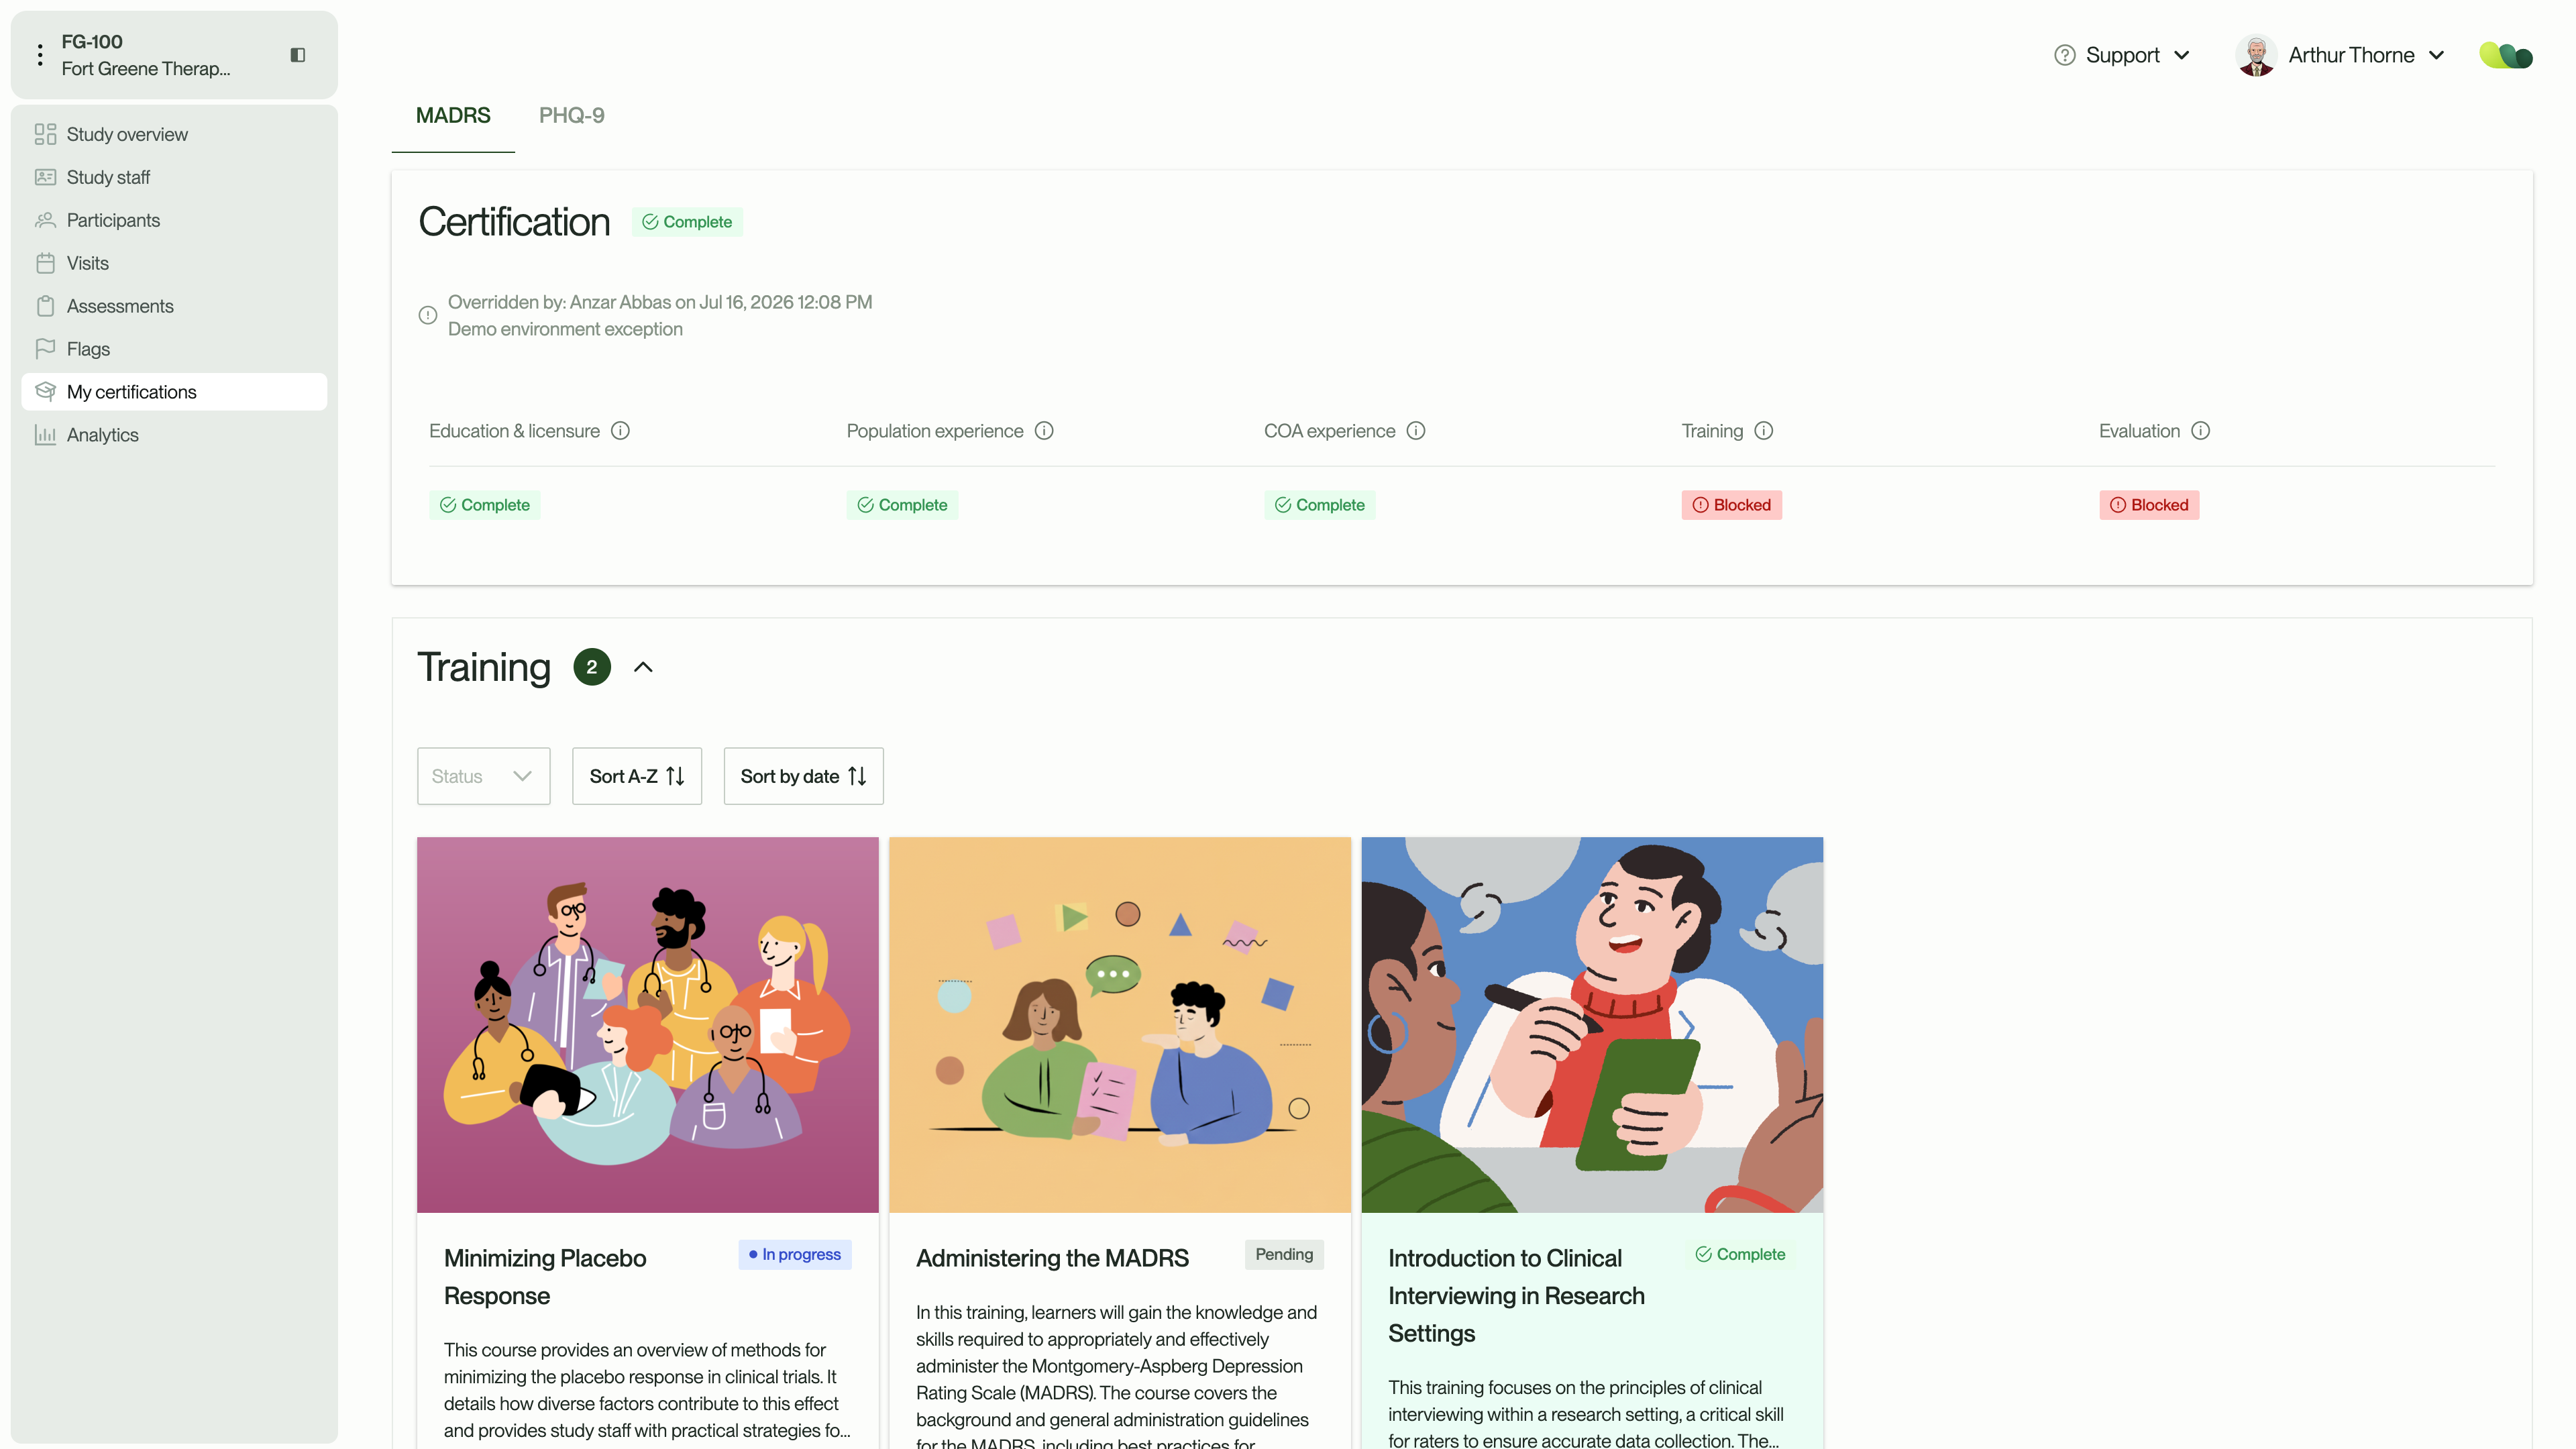
Rater training and certification
Verify rater competency before study onboarding. Self-guided certification removes administrative delays to accelerate site activation.
02
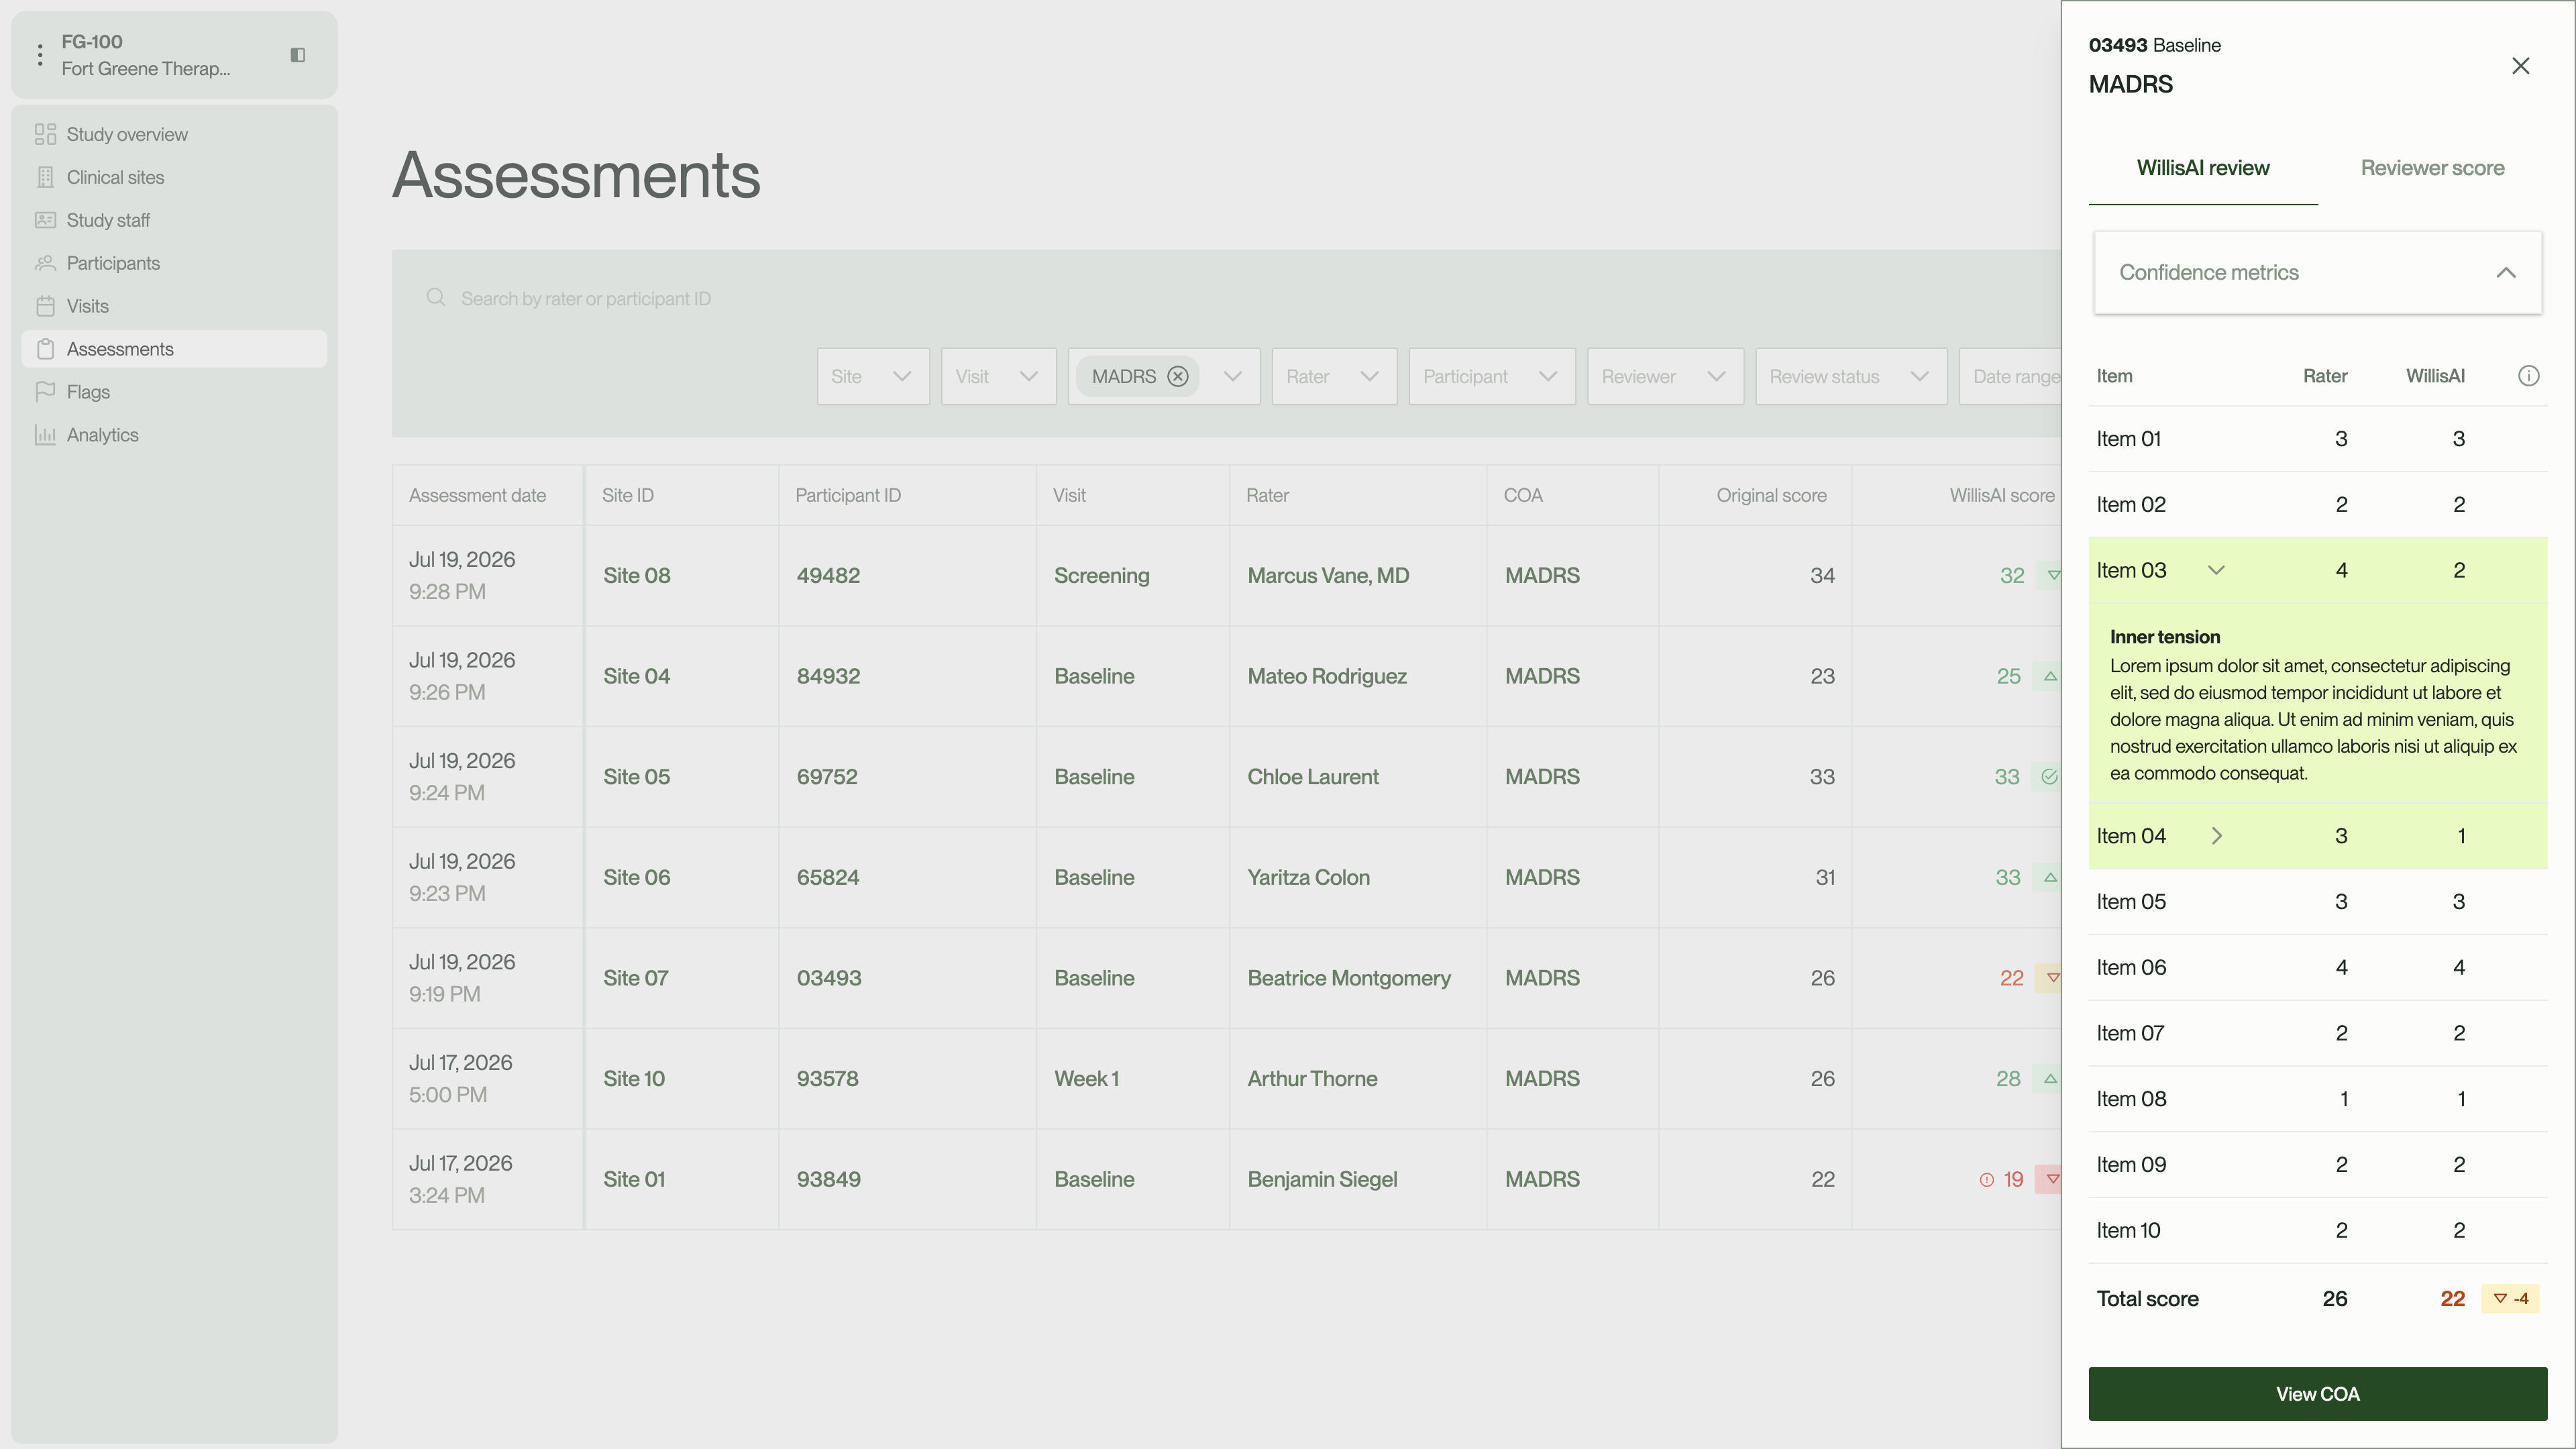
Endpoint quality monitoring
Let WillisAI review 100% of assessments for quality in near real-time. Route flagged assessments to expert clinical raters for advanced review.
03
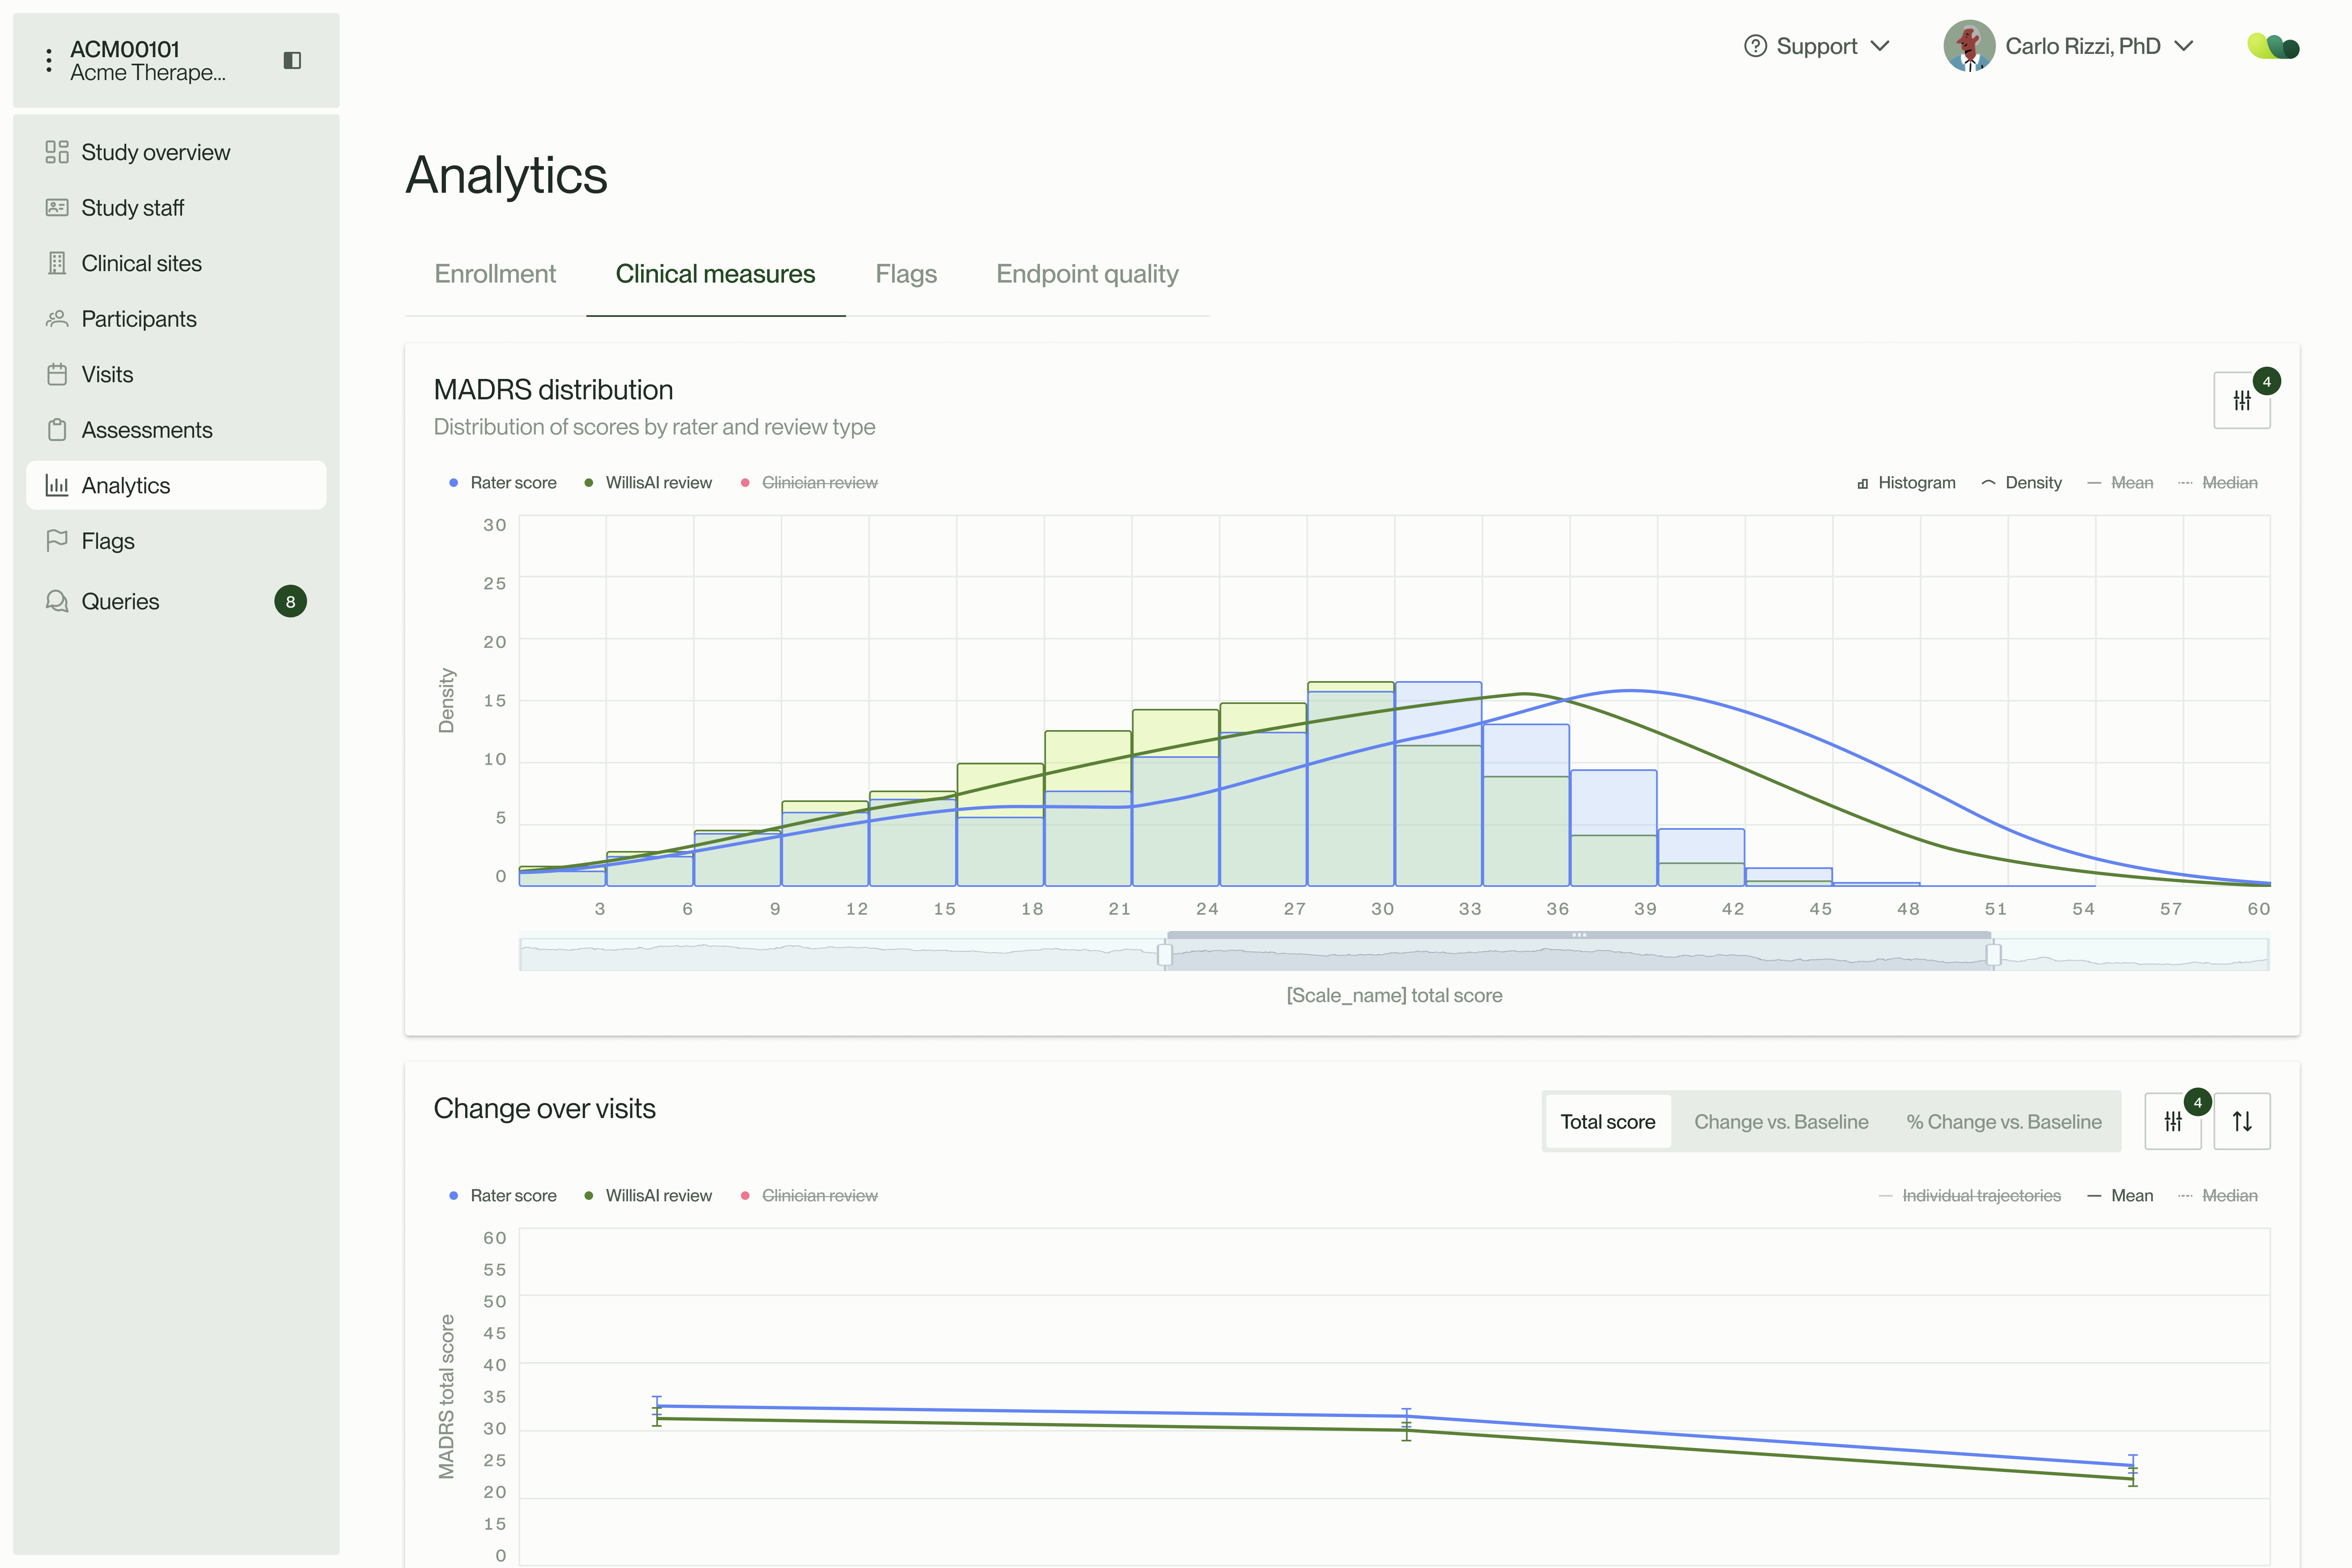
Data analytics and flags
Monitor your study through real-time event flagging and powerful analytics dashboards designed specifically for CNS clinical trials.
Introducing

Willis Academy
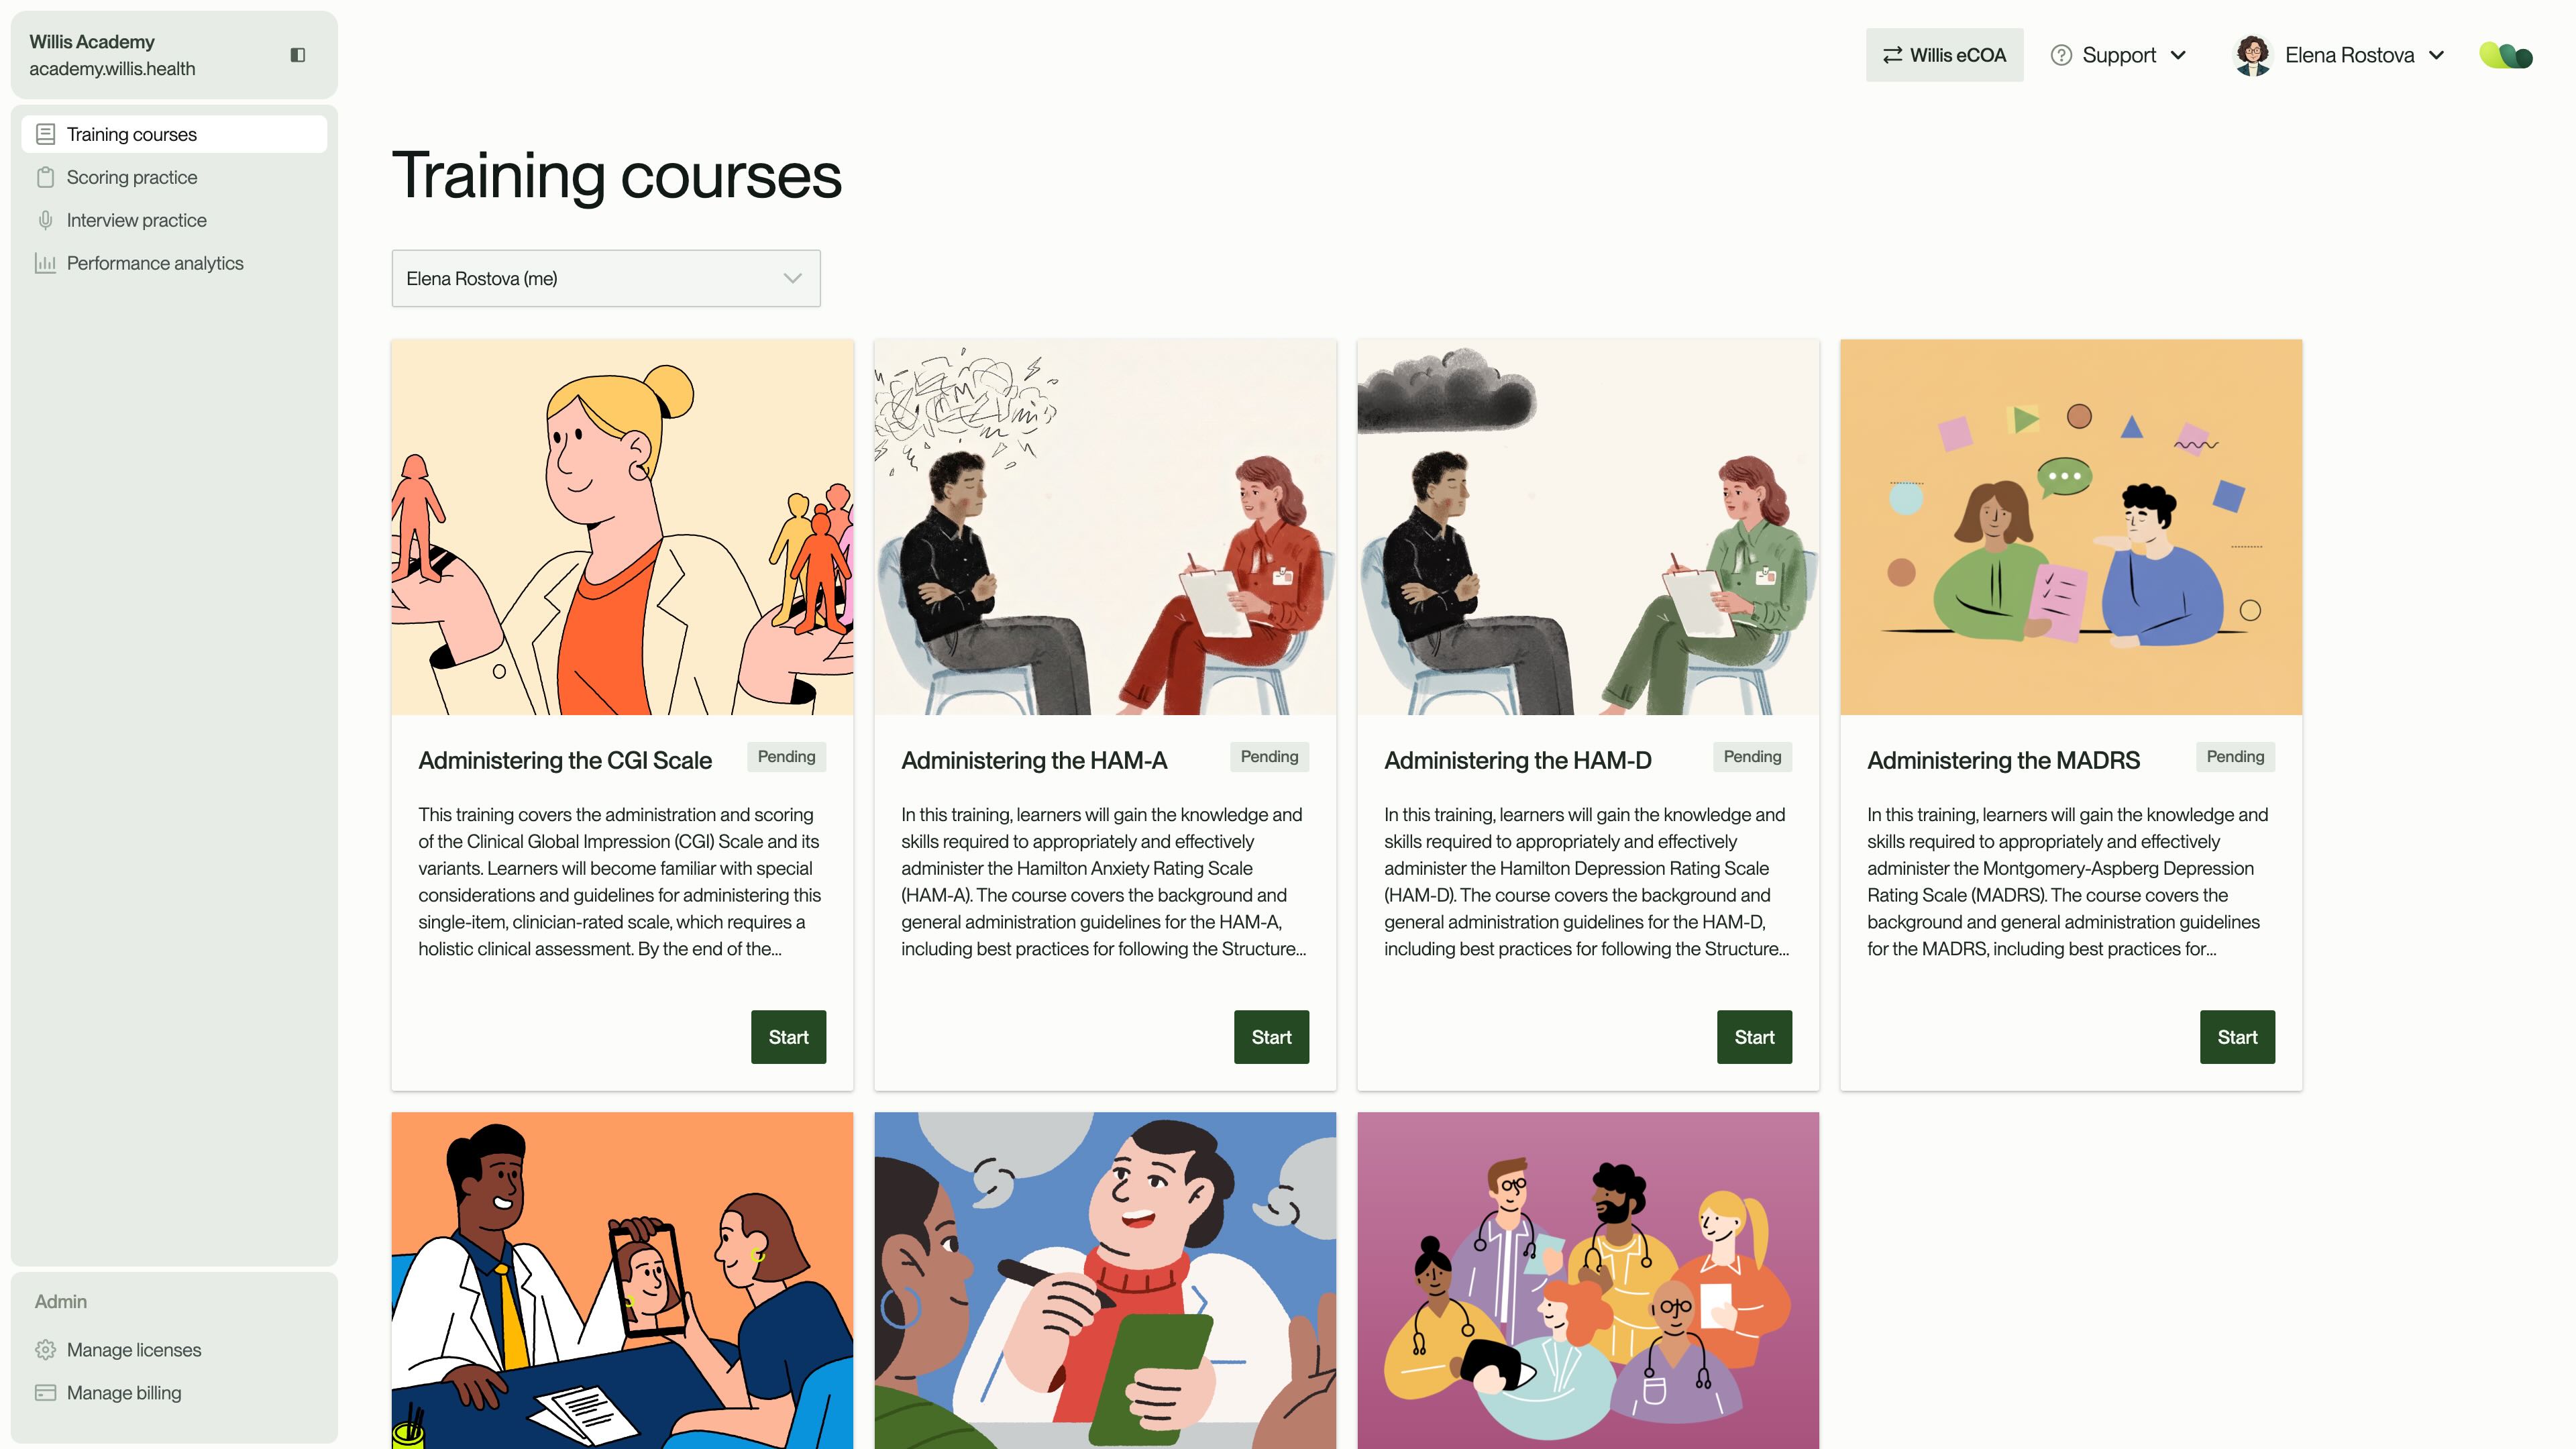
Access our full course library independent of active trials.
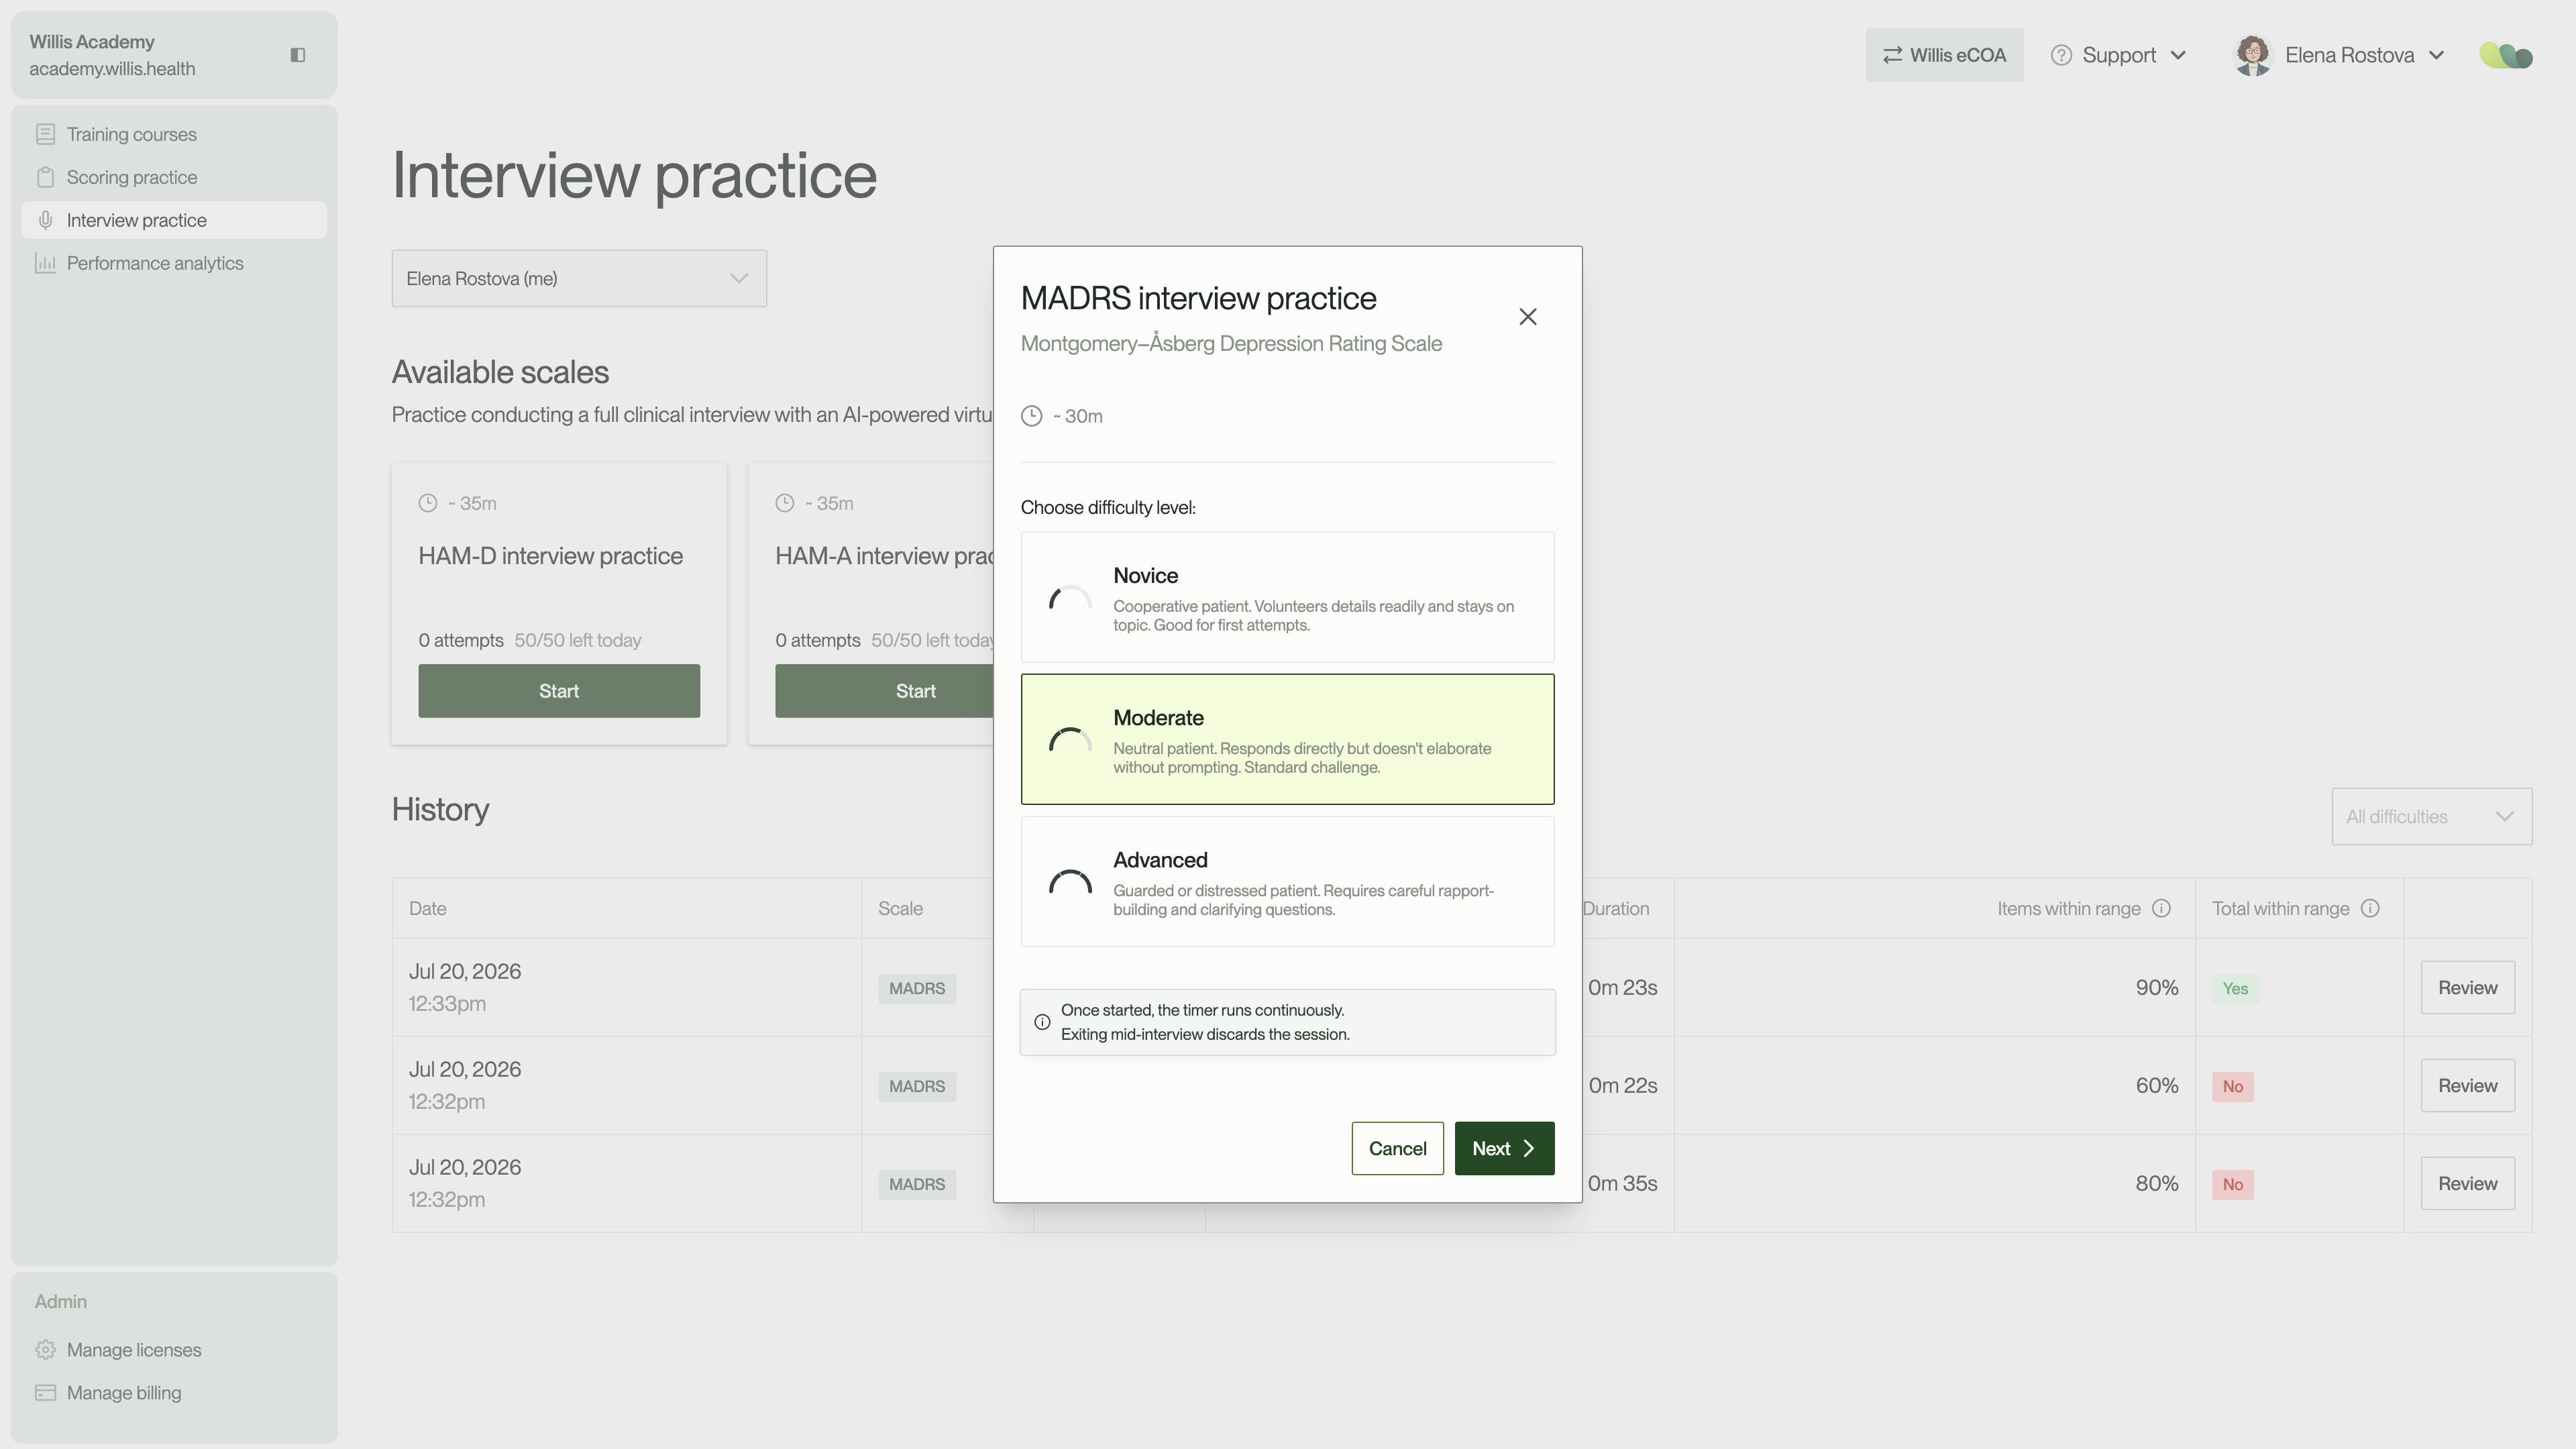
Practice clinical interviewing with our AI-powered virtual patients.

Track your team's progress over time and ensure comprehension.